
Learning how to check website traffic is all about seeing how your site is performing.
Regardless of specifics, the reasons for doing this all fall under the same high level motivation. That is – you want to understand more about your website visitors: how many there are, where they’re coming from and what they’re doing.
This post introduces you to website traffic analysis and is aimed at beginners or people who’ve never really done it properly before. It’s not a deep dive into analyzing specific marketing techniques which is more advanced and way too big a topic for one post.
So, I’m going to explain the 3 best ways to check website traffic for beginners, as follows:
- Complete & powerful – Google Analytics
- Most convenient – Google Analytics with WordPress
- SEO focused traffic check – Ubersuggest
Get comfy, here we go.
1. Google Analytics

Google Analytics is a free, one-of-a-kind tool to check website traffic and analyze visitor behaviour.
Learning how to use it at a basic level is vital for understanding where your website visitors come from and how they behave on your pages.
To get set up, simply click the link above and sign up for a free account. Once done, you need to connect your website to it which is covered below (next section, number 2).
To get things going, I’ll start with some definitions then progress into performance related stuff from there.
What are the basic metrics on Google Analytics?
Google collects a ton of data from your website, but here are the main metrics you need to know for now:

‘Users’
A user is a visitor on your website. When a person lands on any web page of your site, they are identified as either a new or returning user.
‘Sessions’
A session is the period of time a user is active on your website. The session is not affected by the visitors behaviour in any way. So, it doesn’t matter how many pages they visit, it still counts as the same session.
But, if a user is inactive for 30 minutes or more, any future activity is attributed to a new session. Users that leave your site and return within 30 minutes are counted as part of the original session.
When viewing Google Analytics Home (i.e. the image above), you’ll see the number of sessions as one of the displayed metrics. People often refer to this as the number of visitors per month when the period is set to 28 days.
‘Bounce Rate’
A ‘bounce’ occurs when a single-page session is recorded on your website i.e. a user arrives on one web page, initiating a session, and then leaves your website without visiting any other pa
‘Bounce rate’ is calculated when the single-page sessions are divided by all sessions i.e. the percentage of all sessions on your site in which users viewed only a single page.
A high or low bounce rate can be a good or bad thing. It all depends on the nature of the web page. For example, you’d expect Wikipedia or a glossary of technical terms to have a high bounce rate, right? People arrive looking for some information (usually from a Google search), get what they’re looking for and leave.
Low bounce rates are seldom seen as bad because they imply visitors are consuming more of what a website has to offer. For this reason, most of us aim for a low bounce rate as opposed to a high one.
‘Session Duration’
This one is pretty obvious. It’s a calculation of the average length of all sessions on your website in a given time frame. For example, the image above shows the average session duration as 3 minutes and 1 second over the last 28 days.
‘Pageview’
A pageview (or pageview hit, page tracking hit) is an instance of a page being loaded (or reloaded) in a browser.
Pageviews is a metric defined as the total number of pages viewed in a given time frame.
‘Unique Pageview’
A unique pageview aggregates pageviews that are generated by the same user during the same session.
In other words, if you visit the same web page in a session multiple times, it would count as just one unique pageview (note – the number of times you visited it would count under ‘pageviews’).
‘Avg. Time on Page’
As the name suggest, this is the average amount of time spent on a given page by all users of your website in a given time period.
What should you look at for basic page performance in Google Analytics?
The obvious next step is to work out which of your website pages or posts performs the best i.e. gets the most visits, seems to keep a visitor interested the longest and leads to other pages.
Typically this would involve looking at metrics like:
- Pageviews/ Unique pageviews
- Average time on page
- Bounce rate
You’ll find this information by going to ‘Behaviour’ in the left toolbar, then ‘Site Content’ and then ‘All Pages’.
Note, how there is a ‘?’ at the top of each column – hover over it to learn what that column is measuring. If you do this, don’t be put off by the first sentence which is usually Google explaining how it calculates the metric – read beyond that for the simple explanation!
How to find where your traffic is coming from in Google Analytics
It can be hugely important to know where your traffic is coming from, especially if said traffic could be the result of a specific marketing campaign.
To check from a high level, simply go to ‘Acquisition’ on the toolbar to the left, then click on ‘Overview’.
Here, you’ll see what your top channels are split between:
- Direct – website visits that occurred as a result of a user typing your URL directly into their browser or through bookmarks;
- Organic Search – visitors that came from unpaid listings on search engine results pages (SERPs), also known as organic search traffic;
- Referral – this is when a visitor arrives on your website from another website;
- Social – defined as visitors coming to your website from social media platforms or networks.
It’s also possible to track the traffic from a specific marketing campaign using something called UTM tracking codes. These are not beginner friendly though so definitely do your homework on how to set them up properly or hire help.
Google Analytics is hugely powerful and a mine of information but only if you understand what you’re looking at.
Now, you’ve got the basics in place you can at least get a loose idea of how your website and any given page is doing.
Explore for a while and take a look at all the other reporting that Google Analytics offers.
But, you must make sure you understand the metrics you’re looking at. If any doubt, always do a Google search for the right definition (i.e. from Google itself).
2. Getting Google Analytics within WordPress
Imagine having your Google Analytics account available to you within your WordPress website.
That’s what the MonsterInsights plugin does.
It’s rated as the best WordPress plugin for Google Analytics and is the one most people use, including me. The plugin works you through how to add Google Analytics to your website and then displays the most useful reports right inside your WordPress dashboard.
The free version allows you to view some of the main metrics like Sessions, Pageviews, Avg. Session Duration and Bounce Rate.
If you click the ‘Insights’ tab in the black toolbar to the left, you can also see other information like Top Pages. For most people just getting into their website’s analytics, the free version is fine.
If you need deeper and more powerful tools, then you’ll need the Premium version.
Monster Insights Premium Features
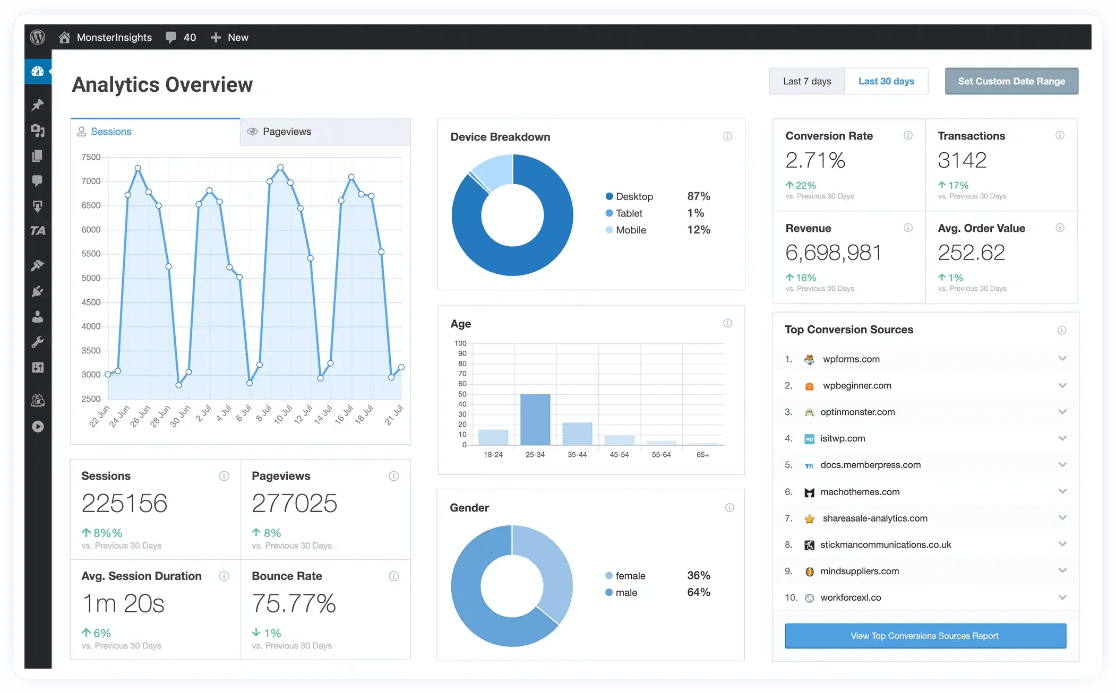
Overview Report
To start, go to Insights » Reports » Overview. Here you can see the overall performance of your website.
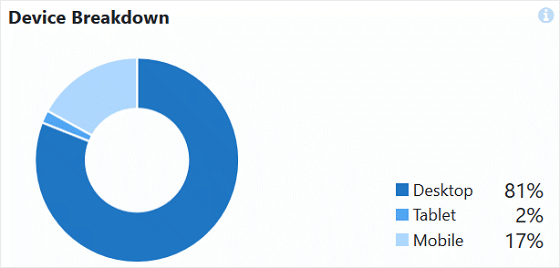
If you scroll down, you can see the Device Breakdown report that shows which device your visitors use to view your website.
Search Console Report
Now, if your site gets some organic traffic, you should know which keywords your site is ranked for. To find that out, go to the Search Console Report.
It shows the top 50 Google search terms for your website along with clicks, impressions, CTR (click-through-rate), and average position.
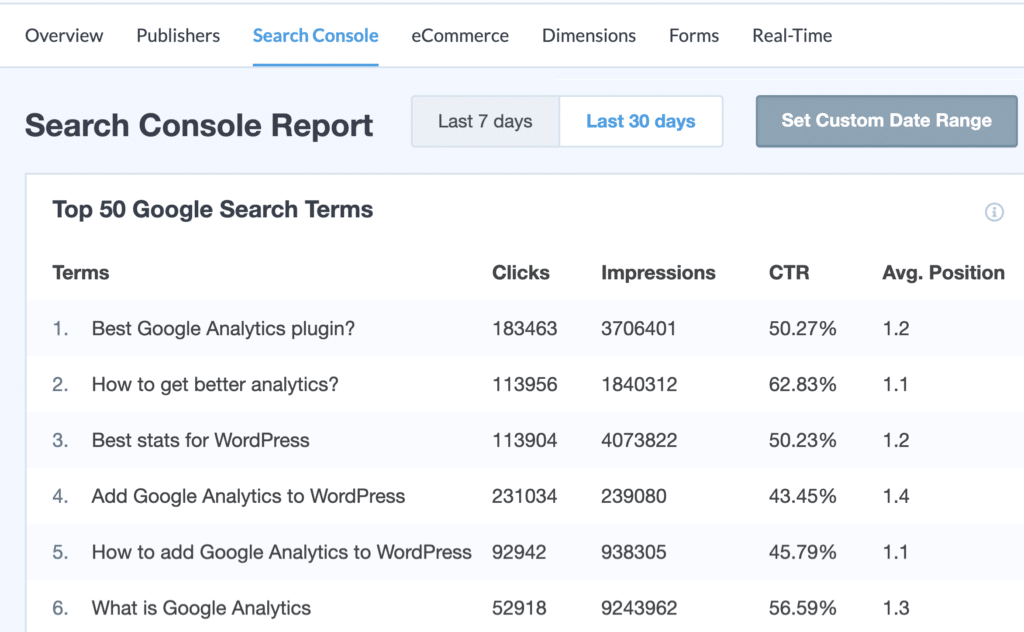
Since these are keywords that bring you your most organic traffic, you can do a keyword search and find similar search terms to optimize for on your site. You can even use them to think of new content ideas to boost your organic traffic.
It’s also possible to configure your WordPress site with Google Search Console.
Realtime Report
This report shows you where your visitors are coming from in real-time. You can see traffic from referral sources, countries, and cities that are currently on your WordPress site.
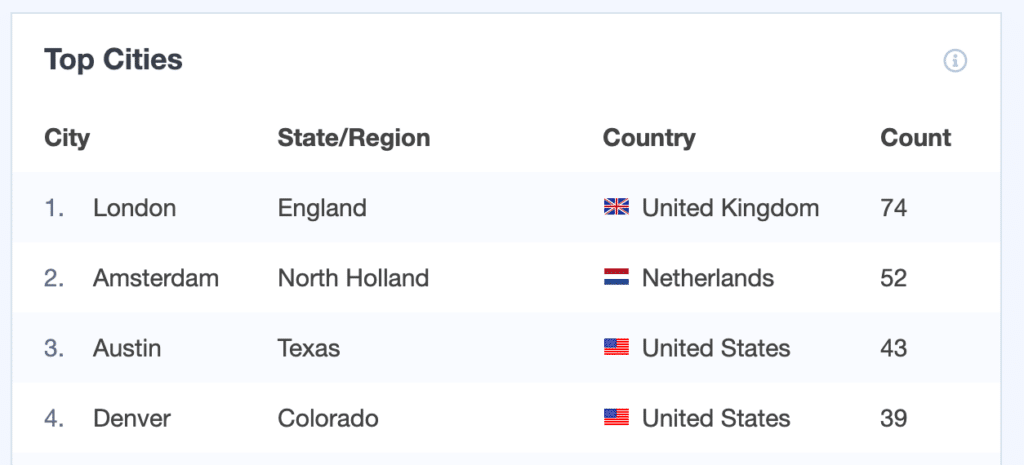
This report is useful to check website traffic if you’ve just launched a new product or a marketing campaign and want to see where visitors are coming from.
3. Ubersuggest

I first stumbled on Ubersuggest when I was studying content marketing many years ago.
As you can see, it’s SEO software. This means it’s focus is on (organic) traffic i.e. visitors that come from search engines, which may or may not be relevant to you.
For example, if the bulk of your marketing activity is on social media, Ubersuggest is no good (you need number 1). Alternatively, if you’ve thought about keywords and maybe done some blogging, then Ubersuggest is perfect.
Simply, go here, enter your website address and click ‘Search’.
The free version allows for 3 searches per day and should be good enough for basic information needs like:
- Number of organic monthly visitors;
- Top ten pages that drive traffic to your website;
- The main keywords your domain ranks for.
The top pages information also indicates how many times that page has been shared on social media. This helps you understand which content seems to be preferred. Add that to the basic keyword research you can do and Ubersuggest could really help steer your content going forward.
Summary
And that’s a wrap.
Now you know how to check website traffic at a basic level and see what your visitors are doing on each page. Use the insights to adapt, tweak or create new pages and explore within analytics to find out other key information.
Beyond this post, there’s loads more to learn if you want to get into more specific marketing tracking. To this end, hop on my newsletter as it’s likely I’ll post on this at some point in the near future.